

The Hidden 2-5% Margin Leak in Mid-Market Industrial B2B
Mid-market industrial manufacturers bleed 2-5% of revenue to pricing leakage every year. Research-backed breakdown of the four places the margin goes.
Samir Jokar
7/11/20264 min read
Mid-market industrial manufacturers lose 2-5% of revenue to pricing leakage every year.
That's the finding of Yggra's industrial B2B pricing research, and it aligns with two decades of McKinsey, Simon-Kucher, and Bain studies on B2B margin operations.
On €200M in revenue, that's €4-10M annually. On €500M, it's €10-25M. It doesn't show up on the P&L — because the money never gets earned in the first place.
Here are the four leaks, ordered by financial impact, with the research that documents each.
1. Uniform pricing across customers with different willingness to pay
The largest leak isn't operational — it's strategic. Not every customer values the same product equally. Some derive materially more value. Some are willing to pay a premium that never gets asked.
The evidence is unambiguous. Bain's survey of 400+ B2B purchasing executives found:
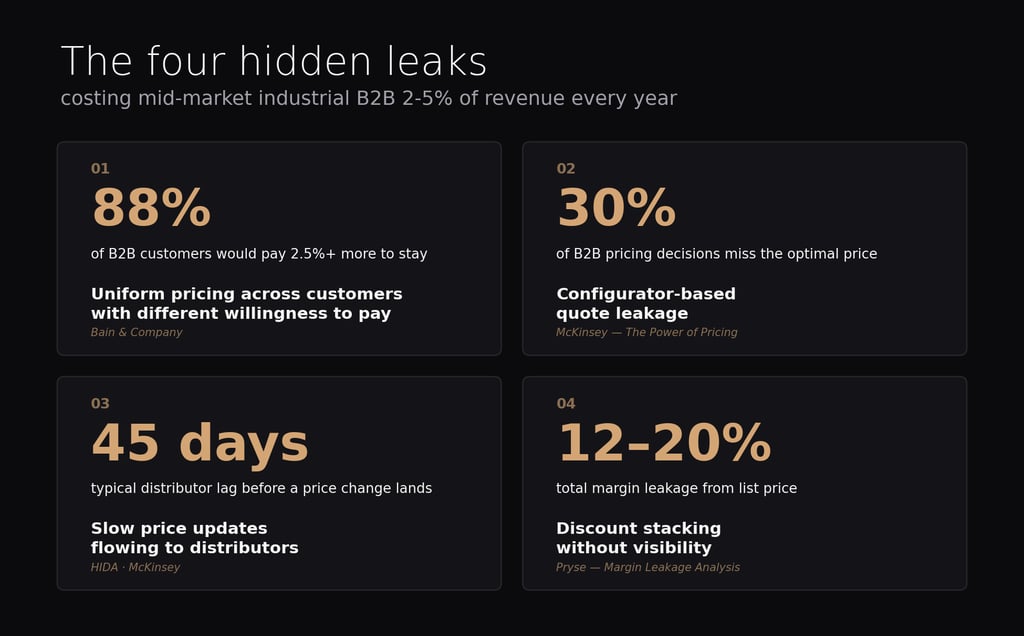
88% of B2B customers would pay at least 2.5% more to avoid switching suppliers — a premium suppliers rarely capture
Customers pay a 4.2% premium for higher quality and 3.1% for reliable delivery
In hardware/software categories: 8.4% more for better integration, 7.2% for customization, 7.0% for ease of use
Yet most mid-market industrial manufacturers price uniformly. Everyone in a distributor tier pays the same. Every customer of a similar size pays the same. The Excel sheet doesn't segment.
The academic literature quantifies the cost. An empirical analysis of optimal nonlinear pricing in B2B markets found that moving from a single linear price to segmented pricing improves firm profit by at least 8.2% — before accounting for the competitive information advantage segmentation creates.
The leakage runs in both directions:
Overcharging price-sensitive customers → defection. A customer who would have stayed with a 5% discount instead goes to a competitor. What's lost isn't a single deal — it's a multi-year account and the switching-back friction that will never be tested.
Undercharging value-realizing customers → money left on the table. A customer willing to pay a 5-10% premium — because they derive greater value from the same product — pays the same list price as everyone else.
Bain's own framing captures it: "They leave money on the table and leave the door open for competitors that understand the power of effective pricing."
The root cause is unused data. Every quote, every negotiation, every won-and-lost deal contains signal about willingness to pay. Uniform pricing throws that signal away.
2. Configurator-based quote leakage
For manufacturers with configurable products — machinery, industrial electronics, systems with dozens of options — the quote itself becomes a leak point.
Every configuration combination compounds:
Base price
Option-specific pricing (dozens to hundreds of variants)
Distributor tier discount
Volume discount
Contract-specific terms
Currency conversion
Ad-hoc negotiation drops during customer conversation
McKinsey's data suggests up to 30% of pricing decisions fail to deliver the optimal price (McKinsey, "The Power of Pricing"). For a €500M business making thousands of configured quotes per year, that's material.
Yggra's industrial B2B analysis reinforces this: "Industrial B2B businesses lose, on average, 2 to 5 percentage points of net margin to invisible pricing leakage" — largely driven by configuration and quote-stage inconsistencies (Yggra).
3. Slow price updates flowing to distributors
McKinsey's foundational research on B2B pricing found that off-invoice leakages average 16.3% of standard list price (Marn & Rosiello, HBR 1992, updated in multiple McKinsey studies since).
The largest hidden contributor: pricing changes not reaching distributor quotes fast enough.
Industry benchmarks:
HIDA industry standard: distributors receive 45 days' notice of pricing changes (HIDA)
Intuilize benchmark: 2-week lag between vendor cost changes and updated customer-facing prices (Intuilize)
Industrial Distribution (2021): "not uncommon to hear it can take up to four months to update pricing" (Industrial Distribution)
The Lab Consulting case study: distributor ERP price update lead times averaged 62 days pre-automation (The Lab Consulting)
Meanwhile, competitors' prices, input costs, and currency rates keep moving. Every day a stale price sits in a distributor's quoting tool is a day of lost margin — either the deal wins at too-low a price, or a competitor undercuts you.
4. Discount stacking without visibility
Distributor discount + volume discount + promotional discount + payment-term discount often stack when they shouldn't.
Sales reps — especially at distributor partners — don't have real-time visibility into margin impact. They optimize for the win, not the margin.
Pryse's analysis of distribution pricing shows total leakage between 12% and 20% of list price, with 2-5% being recoverable — meaning caused by process failures, not intentional discounting (Pryse).
McKinsey adds a critical multiplier: "a 1 percent price increase translates into an 8.7 percent increase in operating profits" (McKinsey). The inverse also holds — every point of margin lost to discount stacking compounds through operating profit at the same rate.
What this actually costs
Applying the research-backed 2-5% recoverable leakage rate to a mid-market industrial manufacturer:
€50M revenue → €1M (2%) to €2.5M (5%) recoverable leakage
€200M revenue → €4M (2%) to €10M (5%) recoverable leakage
€500M revenue → €10M (2%) to €25M (5%) recoverable leakage
For most mid-market industrial manufacturers, this is between one and three times the annual budget of the entire pricing operations team. It doesn't get talked about because it doesn't show up on the P&L — but it never gets earned in the first place.
Four questions worth asking your team this week
What's the price variance across your customers for the same SKU? If everyone pays within 5% of list, you have Category 1 leakage — you're not capturing customer-level willingness to pay.
On configurator-based deals, what's the average delta between intended margin and actual pocket margin? If you don't measure it, you have Category 2 leakage.
How long does it take a list-price change to appear in a distributor quote? If the honest answer is "weeks," you have Category 3 leakage.
How many of your quotes have three or more stacked discounts applied? If the answer is "most of them," you have Category 4 leakage.
The 2-5% number isn't an accident. It's what the research finds when someone actually looks.
Sources
Primary research:
McKinsey. The Power of Pricing
McKinsey. The Hidden Power of Pricing: How B2B Companies Can Unlock Profit
Marn & Rosiello. Managing Price, Gaining Profit — Harvard Business Review, 1992
Bain & Company. Clearing the Roadblocks to Better B2B Pricing
Bain & Company. Is Pricing Killing Your Profits?
Simon-Kucher. Global Pricing Study 2019
Simon-Kucher. Introduction to B2B Dynamic Pricing
Industry benchmarks & academic research:
Ghili et al. An Empirical Analysis of Optimal Nonlinear Pricing in Business-to-Business Markets — arXiv, 2024
Yggra. Margin Leakage: Restore Silent Profit Losses in Your SME
Pryse. Margin Leakage Calculator: Formulas & Excel Walkthrough
Intuilize. Hidden Profits: Why Your Pricing Strategy Matters
The Lab Consulting. Distribution and Manufacturing Pricing Capability Improvement
HIDA. Collaborate With Your Distributor To Ensure Pricing Accuracy
Industrial Distribution. Now Is the Time for Distributors to Ditch Spreadsheets


Custom pricing automations for industrial B2B - built on your existing stack, owned by you.
CONTACT